Case study / United Nations Viet Nam
UN–Government Digital Cooperation & Strategic Alignment
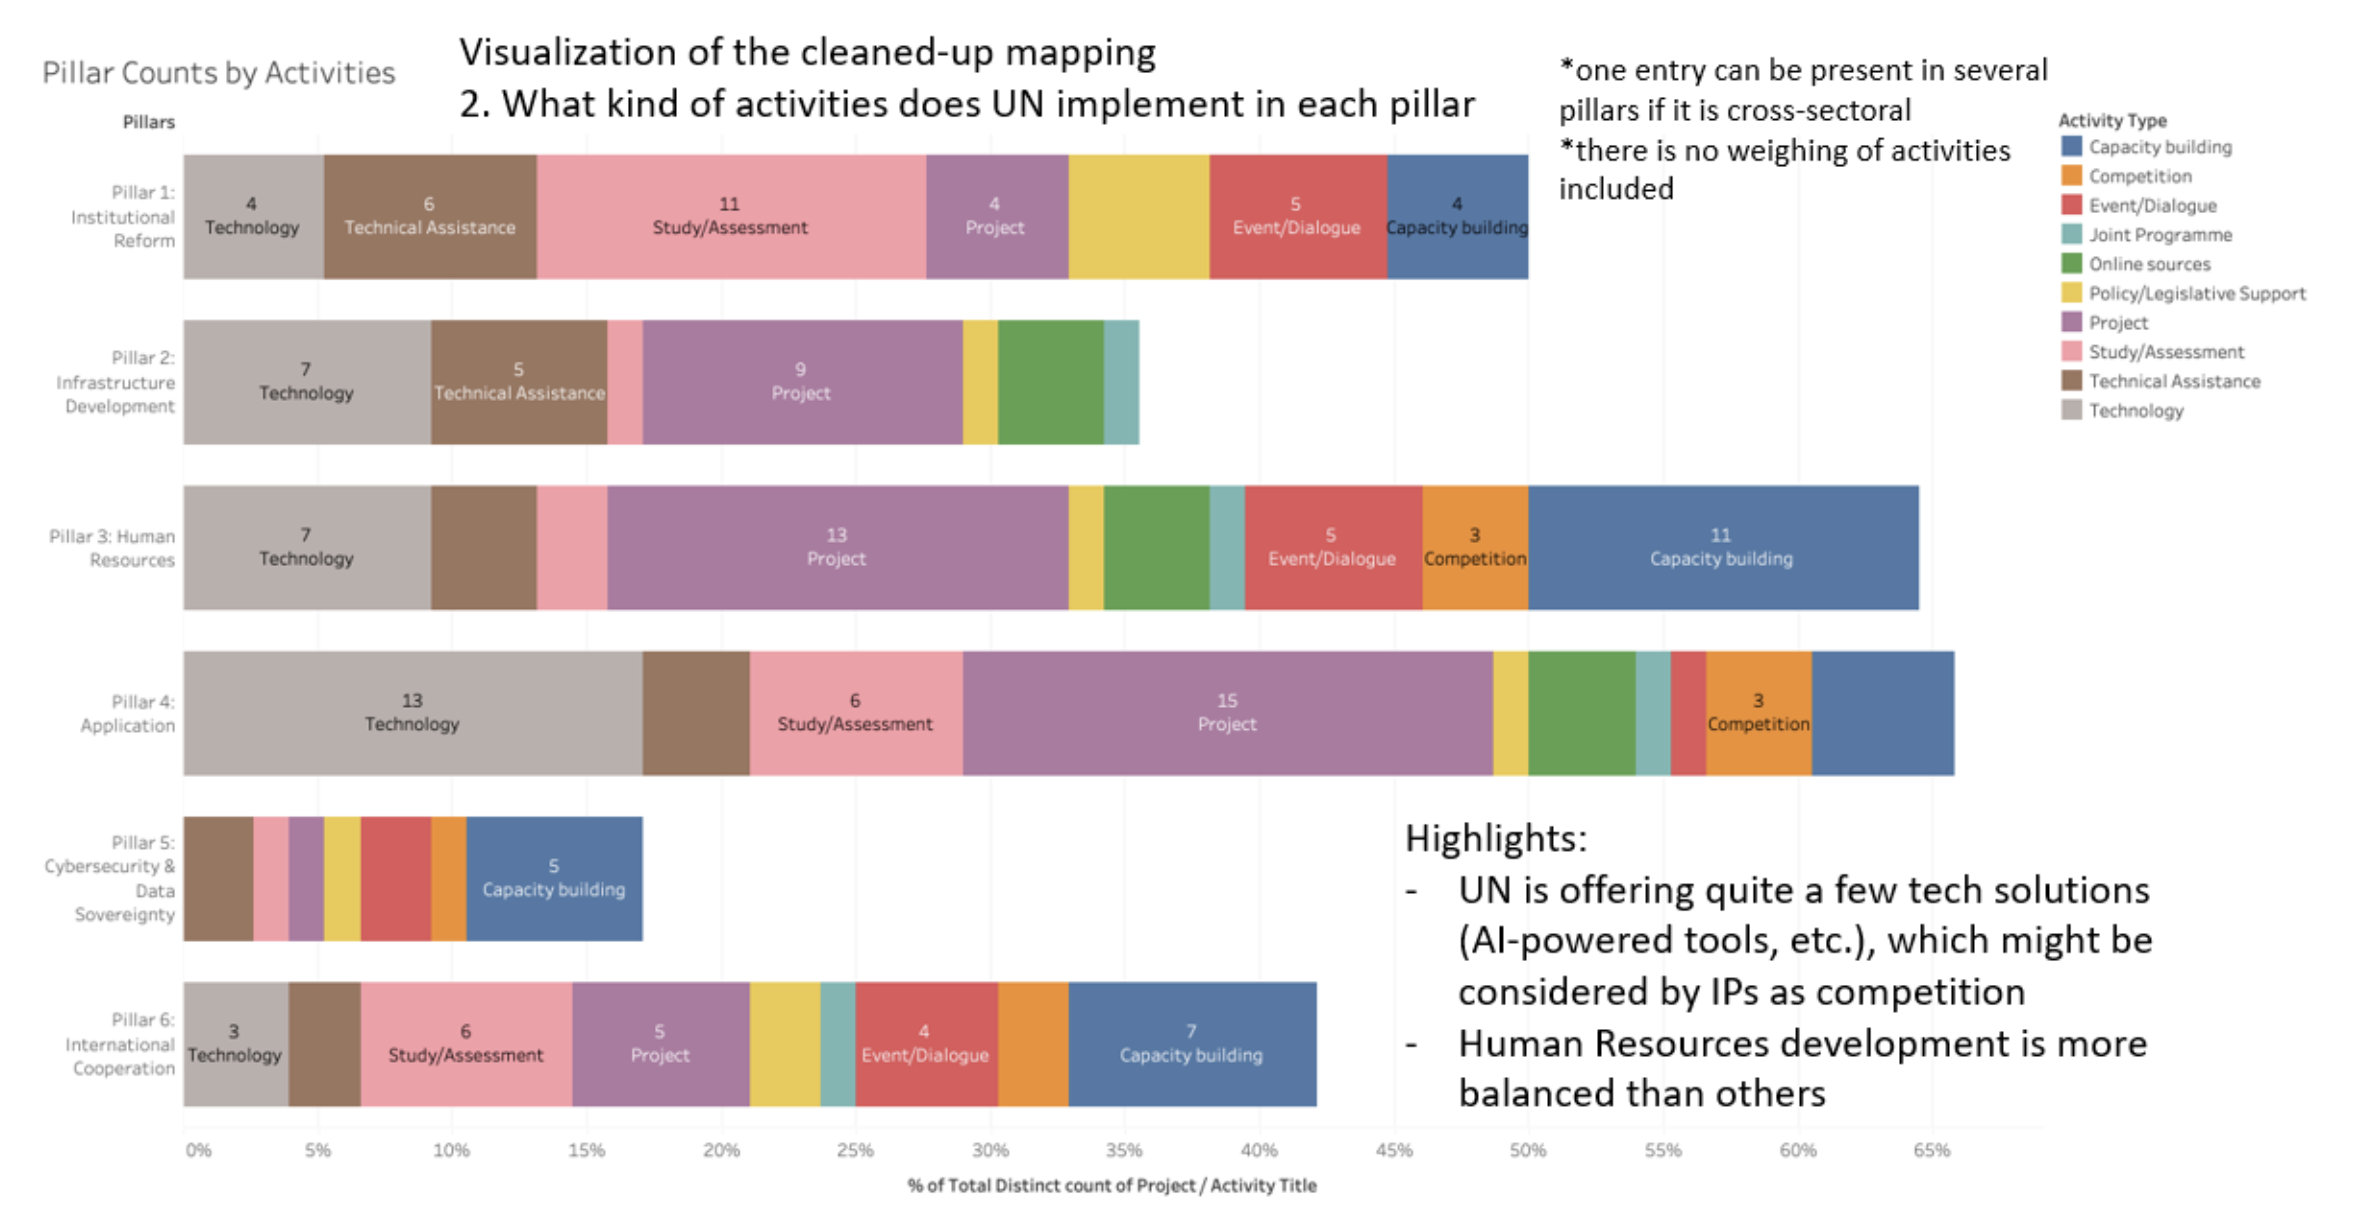
Supported a high-priority, one-time UN–Government digital cooperation initiative by transforming fragmented information on UN Country Team activities into a centralised view of how initiatives aligned with Viet Nam’s national development priorities.
The challenge
Create a clearer way to understand and communicate how UN Country Team initiatives contributed to Viet Nam’s national priorities.
Approach
Discover
Gather requirements from UN colleagues and understand how the information would be used.
Structure
Define the required data and centralise initiative information using Excel.
Prepare
Clean, organise, and standardise the collected information.
Augment
Use AI as a support tool for analysis, problem-solving, learning, and dashboard development.
Visualise
Build a Tableau dashboard showing UN contributions and alignment with national priorities.
Tell the story
Translate the dashboard and underlying data into clear strategic narratives.
Communicate
Prepare the insights for UN–Government consultation and senior UN leadership.
My role
I worked with UN colleagues to gather requirements and translate the organisational need into a practical data workflow. I supported the project from data collection and cleaning through dashboard development, visualisation, storytelling, and leadership reporting.
AI as augmentation
I used AI to support parts of my workflow, including analysis, problem-solving, learning, structuring, and dashboard development. I remained responsible for gathering requirements, preparing the data, analysing alignment, building the Tableau dashboard, and communicating the results.
Outcome
The project created a more centralised and visual way to understand UN Country Team contributions and their alignment with Viet Nam’s national priorities. It supported strategic UN–Government consultation through structured data, visualisation, and data storytelling. I reported the resulting analysis to senior leadership, including the UN Resident Coordinator.
Let’s connect
Useful technology.
Meaningful work.
Interested in digital innovation, applied AI, or a potential collaboration?